

Why do we need server optimization?
The fact is that with the growing number of customers on your site, they require prompt service and comfort (after all, this is the only way to successfully grow your business).
In such situations, the following problems begin to arise:
- website pages begin to load slowly
- your website is unresponsive from time to time
- your server goes down during the flow of customers
These problems tell you that the server is overloaded and can't do its job. Your website's availability drops, the server can't handle the traffic, and you lose money.
Of course, in this case, there is a risk of losing even your regular customers. Even the most patient of them can go to a competing site, tired of waiting for access to yours.
We recommend paying attention to server performance before you run into the problems above. A fast server lets every customer feel comfortable on your site, and that directly affects how your business grows.
What is server optimization?
Server optimization is tuning the whole path a request takes, from the web server to the application and the database, so that the server answers faster and handles more traffic on the same hardware.
When a visitor opens a page, the web server gets a request for it, processes it and generates a response. How fast that happens depends on how every layer on the way is configured: the web server, the application runtime (for example, PHP), the caches and the database.
Many users and business owners replace hardware with more powerful machines and expect the server to speed up. But this doesn't always meet expectations: if the bottleneck is a missing index or a cache that isn't there, a bigger server just makes the same mistake faster and costs more every month.
A correct server optimization approach
Our DevOps engineers recommend going the other way:
- Find the bottleneck with monitoring, logs and real response-time measurements, before changing anything.
- Configure and tune the web server.
- Put Nginx in front of the application to serve static files and cache responses where it's safe.
- Configure the MySQL or MariaDB database server:
- size the InnoDB buffer pool to fit your working data set;
- turn on the slow query log and fix the slowest queries;
- add the indexes those queries are missing.
- Enable and tune OPcache, the opcode cache built into PHP.
- Use Redis or Valkey for application object and session caching.
- Serve static content through HTTP caching and a CDN (Nginx, Varnish, Cloudflare, Amazon CloudFront).
- Tune the operating system settings that matter for your load.
Old guides still recommend PHP accelerators like XCache or eAccelerator. Both projects were abandoned in the PHP 5 era and don't work with PHP 7 or 8. OPcache replaced them: it has been part of PHP since 5.5, and since PHP 8.5 it is always compiled in. The same goes for the MySQL query cache: it was removed in MySQL 8.0, so "turn on query caching" is no longer a tuning step.
What it looks like in practice
Here is what the main steps look like on a typical stack. The examples are tested on Ubuntu 26.04 with Nginx 1.28, PHP 8.5, MySQL 8.4 and Valkey 9.
Check and tune OPcache
OPcache is on by default in PHP-FPM. Check what the FPM process actually uses (the CLI can have different settings):
shell
1php-fpm8.5 -i | grep -E '^opcache\.(enable|memory_consumption|validate_timestamps) 'On a production server with a large codebase, give OPcache more memory and stop it from checking every file on each request. Create /etc/php/8.5/fpm/conf.d/99-opcache-tuning.ini:
shell
1opcache.memory_consumption=2562opcache.interned_strings_buffer=163opcache.max_accelerated_files=200004opcache.validate_timestamps=0With opcache.validate_timestamps=0, PHP won't notice changed files until you reload PHP-FPM, so make sudo systemctl reload php8.5-fpm part of every deploy.
Size the database buffer pool and find slow queries
The InnoDB buffer pool is where MySQL keeps data and indexes in memory. The default is 128 MB, which is too small for most production databases. The MySQL manual notes that dedicated database servers often give it up to 80% of physical memory; if the database shares the server with PHP and Nginx, start lower. Create /etc/mysql/mysql.conf.d/99-tuning.cnf:
shell
1[mysqld]2innodb_buffer_pool_size = 1G3slow_query_log = 14long_query_time = 1After a restart, every query slower than one second lands in the slow query log. Those queries are your shortlist for new indexes and code fixes.
Keep sessions and objects in Valkey or Redis
Sessions stored in local files stop working reliably as soon as a load balancer spreads users across two servers. Install the php8.5-redis extension and point PHP sessions to Redis or Valkey (Valkey speaks the same protocol):
shell
1session.save_handler=redis2session.save_path="tcp://127.0.0.1:6379"The same server can cache expensive database results inside your application. When one server is no longer enough, shared sessions are what lets you add more: we show the whole setup in scaling a PHP application across several Nginx nodes.
Let Nginx cache static files
Static files shouldn't touch PHP at all. Let Nginx serve them with long cache headers and compress text assets:
nginx
1gzip on;2gzip_types text/css application/javascript application/json image/svg+xml;3
4location ~* \.(css|js|png|jpg|jpeg|webp|svg|woff2)$ {5 expires 30d;6 add_header Cache-Control "public";7 access_log off;8}Our previous experience

This is Nginx response codes and response time from one of our client's servers over a week. At peak it serves over 30,000 successful responses per interval with an average response time of about 11 ms. We also have per-domain statistics, but this information is under NDA: we take care of our customers and the security of their business ;)
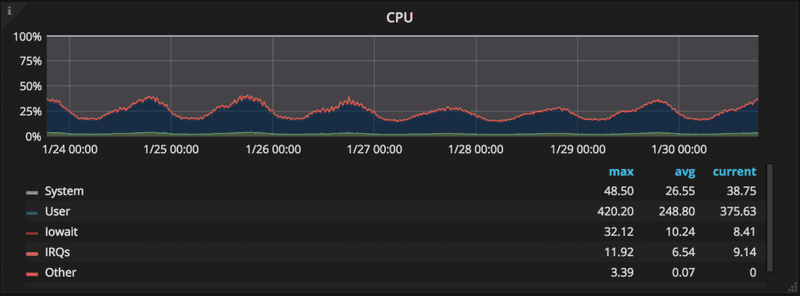
Here you can see CPU utilization on the same server during that week. Daily peaks stay well under the limit. And this is just one server in a scalable infrastructure, so the whole platform handles many times more load. On a new project, we start with an infrastructure review of your requirements and current load, then build the most cost-effective configuration.

This is aggregated network traffic by hour over 24 hours. The server received about 57 GiB and sent about 883 GiB in a day, with hourly peaks close to 59 GiB, and it handled the spikes without going down.
Optimization rarely starts from a clean slate. When a hosting company in Iceland brought us in, there was a backlog of 41 critical infrastructure tasks; we cleared it in a single day and then kept the servers tuned 24/7.
How to understand that server needs to be optimized?
Start with real numbers, not with a feeling that the site is slow.
PageSpeed Insights shows how fast your pages load for real Chrome users and gives a lab test on top. Other tools like the Pingdom Website Speed Test let you pick the test location and show a waterfall of every file the page loads.
To see the server part alone, measure time to first byte (TTFB) with curl:
shell
1curl -s -o /dev/null -w 'dns: %{time_namelookup}s\nconnect: %{time_connect}s\ntls: %{time_appconnect}s\nttfb: %{time_starttransfer}s\ntotal: %{time_total}s\n' https://example.com/Run it a few times and from a location close to your users. Google's guidance is a TTFB of 0.8 seconds or less and a Largest Contentful Paint of 2.5 seconds or less. If your TTFB is above 0.8 seconds on simple pages, something on the server side is not configured well, and the steps above are where we'd start looking.
Recommendations
We recommend the approach and steps described above to make your server optimized and stable. Start by measuring TTFB on three pages: the home page, a heavy page and a static file. If only the heavy page is slow, look at the database and the slow query log. If every page is slow, start with OPcache and PHP-FPM. If even the static file is slow, the problem is the network, TLS or the web server itself. Send the numbers to sales@itsyndicate.org, and our engineers will tell you which layer to look at first.